Fitulator
Body Fat Percentage Chart for Men and Women
Enter your body fat percentage to see which category you land in on the chart below. Not sure of your number yet? Estimate it with the Navy Body Fat Calculator or the body fat calculator on the home page, then come back.
More Calculators
Check the Army's 0.55 standard.
Run the Navy's current two-step assessment.
Find out how much of your weight is not fat.
Compare your lean mass for your height.
Set a goal weight, calorie and protein target.
Check your waist against your height.
See how your fat is distributed.
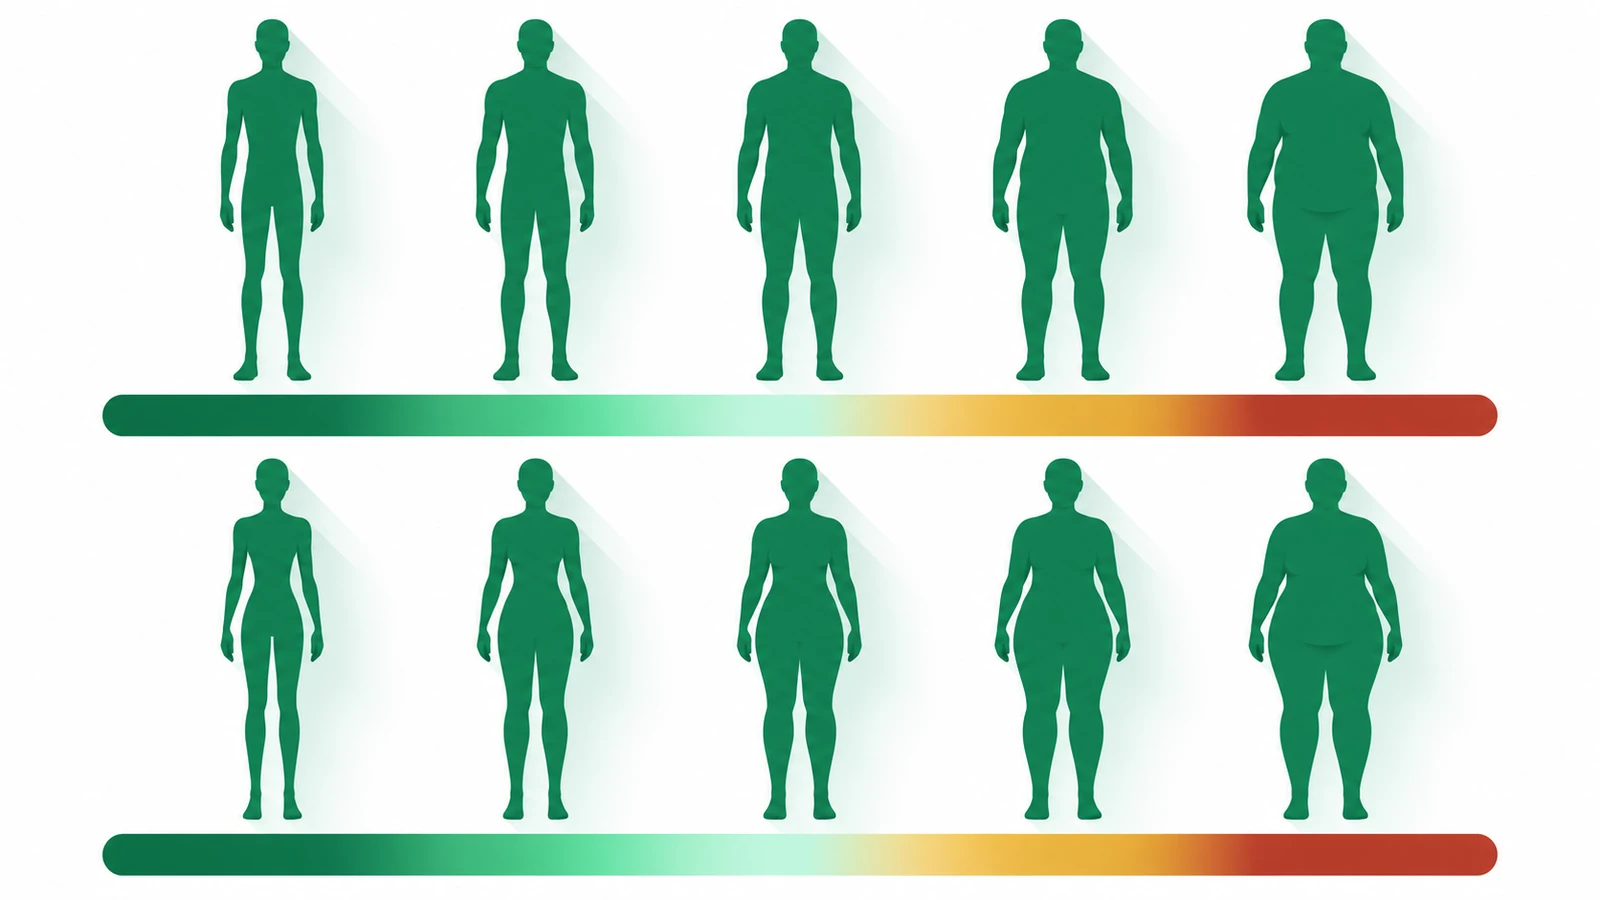
Body Fat Categories for Men and Women
| Category | Women | Men |
|---|---|---|
| Essential fat | 10-13% | 2-5% |
| Athletes | 14-20% | 6-13% |
| Fitness | 21-24% | 14-17% |
| Average | 25-31% | 18-24% |
| Obese | 32% and up | 25% and up |
These categories come from the American Council on Exercise (ACE) and do not change with age. Essential fat is the minimum your body needs to function, so going below it is unhealthy.
Healthy Body Fat Percentage by Age
Body fat tends to rise with age. A widely cited study by Gallagher and colleagues built healthy ranges for adults from BMI guidelines, shown here for three age groups:
| Age | Women | Men |
|---|---|---|
| 20-39 | 21-33% | 8-20% |
| 40-59 | 23-34% | 11-22% |
| 60-79 | 24-36% | 13-25% |
The two tables were built differently, so they do not line up exactly. Neither one came from tracking how people with different body fat levels fared over time, so treat them as reference points and not as proven health limits.
Neither the ACE categories nor the Gallagher age ranges come from studies that followed people’s health over time — treat them as reference points, not strict cut-offs.
What Is a Good Body Fat Percentage?
For most adults, a good target is the healthy range for your age and sex. Going lower is not automatically better. Very low body fat can be hard to sustain, and for women it can interfere with normal hormone function. Being in the athlete range makes sense if you train for it. It is not something everyone needs to aim for.
How to read this chart
- Find the column for your sex.
- Find the row that matches your measured body fat percentage.
- To check by age, use the healthy-range table instead of the category table.
Why Women Have Higher Body Fat Than Men
Women carry more essential fat than men, which is why every category on the chart sits higher for them. A woman at 24% and a man at 15% can both be in the fitness range. Always compare your number with the correct column.
Numbers to Check Alongside Body Fat
- The waist to height ratio calculator shows how much fat you carry around your middle.
- The waist to hip ratio calculator shows how your fat is distributed.
- The lean body mass calculator shows the part of your weight that is not fat.
- The navy body fat calculator shows how you measure up against the Navy’s current standard.
Body Fat Percentage for Abs
Visible abs are mostly a matter of how much fat sits over the muscle. For most men, the outline of a six-pack starts to show around 10-12% body fat and becomes sharp below 10%. For women, essential fat is higher, so abs typically appear around 16-19%. These are ranges, not switches — where your body stores its last fat, and how developed the muscle is, both change the number.
Chasing a very low figure is hard to sustain and, for women, can disrupt normal hormone function. A visible midsection in the fitness range is a realistic goal; competition-stage leanness is not something to hold year-round.
Essential Fat vs Storage Fat
Not all body fat is optional. Essential fat is built into your nerves, brain, bone marrow and, in women, reproductive tissue. Dropping below it — roughly 2-5% in men and 10-13% in women — is unhealthy, not “extra fit.” Everything above essential fat is storage fat, the energy reserve the body draws on. A healthy target keeps enough storage fat to function well without carrying excess.
How the Ranges Are Built
The category table on this page comes from the American Council on Exercise and does not change with age. The age-based table adapts widely cited ranges that rise gradually across decades, because body fat naturally increases with age even at a stable weight as muscle declines. Neither table was built by tracking people’s health against their body fat over time, so read them as reference points rather than hard medical cut-offs.
Why Body Fat Percentage Beats BMI
BMI divides weight by height and stops there. It cannot tell muscle from fat, so it routinely labels muscular people “overweight” and can miss someone with low muscle and high fat at a “normal” weight. Body fat percentage measures what your weight is actually made of, which is why it is a better guide to fitness and health. If you only know your BMI, pair it with a body fat estimate from our body fat calculator.
How Accurate Is a Body Fat Chart?
A chart is only as useful as the number you compare against it, and every home method has a margin of error. The tape-based Navy method is typically within 3-4% of a DEXA scan; smart scales can swing more depending on hydration. Use the same method each time, compare against the correct column for your sex, and watch the trend — a chart is a map, not a diagnosis.
What to Do With Your Number
Once you know roughly where you land, the next questions are usually about muscle and fat distribution. Check the part of your weight that is not fat with the lean body mass calculator, see how muscular you are for your height with the FFMI calculator, and check where you store fat with the waist-to-hip ratio calculator.
Frequently Asked Questions
ACE places average women at 25-31%. For women aged 20-39, the Gallagher range is 21-33%.
ACE places average men at 18-24%. For men aged 20-39, the Gallagher range is 8-20%.
There is no single ideal number. The healthy range for your age and sex is a better target than one specific figure.
The athlete row gives a rough idea, but what suits you depends on your sport, your sex, and your health.
Roughly 10-12% for men and 16-19% for women, though it depends on where you store fat and how developed the muscle is.
Using the ACE categories, above about 25% for men and 32% for women falls into the obese range; the healthy range rises slightly with age.
Through a modest calorie deficit, enough protein and regular training, which lowers fat while protecting muscle.